

This module will explore some of the tools on CIOOS Atlantic’s website. We’ll describe the main CIOOS Atlantic tools here, give a brief rundown about how the tools work, give details on tools specific to each of the CIOOS Regional Associations, and suggest you try one of them yourself.
CIOOS Atlantic Tools
CIOOS Data Explorer
The CIOOS Data Explorer allows you to search, filter, select, and download datasets. This tool allows you to quickly download multiple datasets at the same time and sort by Essential Ocean Variable. One major benefit of the CDE is that you can download datasets from multiple organizations and be assured that they will all be interoperable.
Let’s talk about each element that the CDE can do:
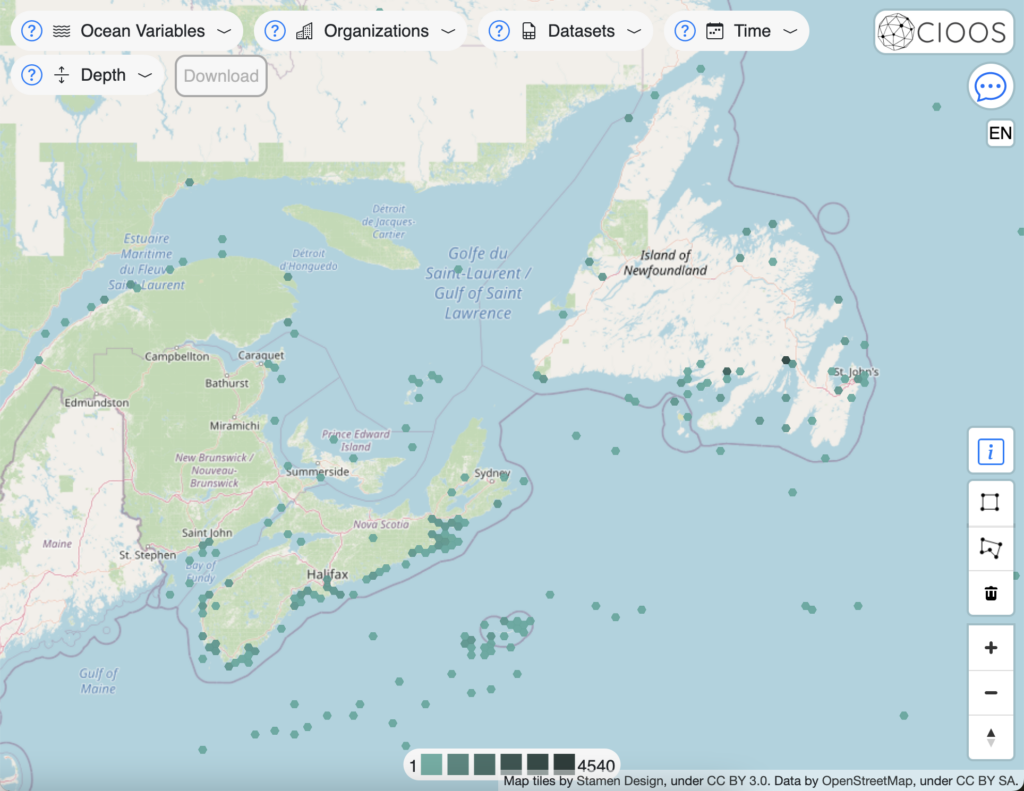
- First, there are the filters; when the CDE is first opened it defaults to showing every possible dataset, as points on a map. Remember all ocean data is geographic, hence the organizing by geography. These filters will help narrow down the particular dataset you might be looking for. You can filter by Essential Ocean Variables, Platforms (the type of platform, and whether surface level or on the seafloor), Organizations, Datasets, Time and Depth.
- The select tool allows you to pick one or multiple datasets. You can use a rectangle, a polygon or select datasets one by one.
- Once you’ve made your selections the Inspect tool will show you a summary of your dataset(s). You can then sort or search within this summary.
- Finally there is the Download tool. Select which of the datasets you want to download and they will be sent to you by email, unless the file size is too large, in which case you will be directed to use ERDDAP for downloading.
CIOOS Asset Map
Using the CIOOS Asset map you can sort datasets by EOVs including oxygen content, what kind of animal it is focused on, or ocean salinity, etc. It shows each dataset that it is filtered by on a map that includes bathymetry mode and street mode.

ERDDAP
ERDDAP allows you to access data in the CIOOS Catalogue. ERDDAP allows you to get data in specific requested formats and . The CIOOS Data Explorer is recommended for downloading data first but you may find ERDDAP works better for you depending on your needs.

- CMAR Birchy Head is a 3D rendered visualization of ocean temperature data collected in the community of Birchy Head.
- CMAR Ship Harbour is a 3D rendered visualization of ocean temperature data collected near East Ship Harbour.

The Saint Lawrence Global Observatory (SLGO) is the second of the three current CIOOS Regional Associations. They have nearly 20 more unique data tools to explore! See them all here.
And CIOOS Pacific, is the third regional association and has even more tool to explore! See those here.
Optional Activity:
Choose any number of these tools and play around with them, exploring how they work and what they can do.
And that will be all for today’s short lesson!
Before you go! Things to consider for the next module:
Is there additional functionality that you wish these tools had? What is it and how would you implement it? Feel free to send us an email at [email protected] with these suggestions!